THE MYTH
Everyone Assumes the Title Opens the Door
Put “Founder & CEO” at the top of a guest bio, and it feels like a credential that does the work for you. Hosts want leaders. Leaders have titles. So the bigger the title, the easier the yes.
Most guests believe it. Most agencies lean on it. Nobody checks.
We checked. For a year, every introduction Interview Valet sent to a podcast host went out with a short, host-facing summary of the guest. The first line of that summary is the guest’s title. It’s the first thing a host reads. So we sorted 94 client campaigns by that first title and compared how often hosts said yes.
Founders and CEOs got invited at the average rate. No premium. The guests who did best were consultants, advisors, coaches, and strategists, whose titles describe what they do for someone.

BEFORE WE START
Why We Say Introductions, Not Pitches
Every report in this series starts with the same note. Interview Valet doesn’t pitch hosts. We introduce a guest to a host the way a mutual friend would: here’s who this person is, here’s why your listeners would be better off for hearing them.
This report looks at the first words of that introduction. The title is where most guests try to prove they belong. The data says it proves less than they think.
Every result in this report is expressed as an index or a percentage. Index 100 means “exactly average.” Raw yes rates and counts are confidential to our clients and our business.
FINDING #1
The Biggest Title Earned No Premium
Founder, CEO, owner, and president titles make up 57% of the campaigns in this study. They’re the most common first line in our guest summaries. Their yes rate indexed at 95 against an all-campaign average of 100 (95% confidence interval: 89 to 101).
Host Yes Rate By The Title A Host Reads First
Founders & CEOs Get Invited At The Average Rate
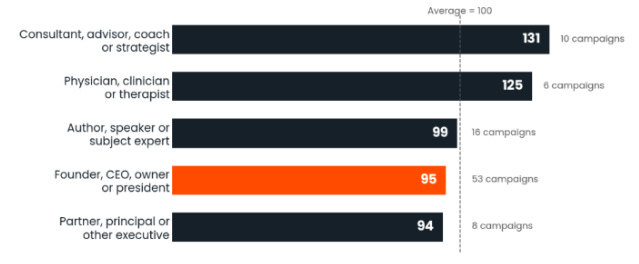
Index: 100 = Average yes rate across 94 campaigns. Pooled across every introduction in each group.
• “Slightly below average” is mostly three campaigns. The three highest-volume campaigns in the study all carry founder titles. Take them out, and the founder index is 98. Look campaign by campaign, and the median founder campaign sits at 98. Every way we cut it, the answer lands on “average.”
• Other leadership titles did no better. Partners, principals, and other executives indexed at 94.
• Authors, speakers, and subject experts landed at 99. Average again.
Bottom Line: Don’t count on the title to earn the yes. A host reads “Founder & CEO” constantly. It tells them who you are, not why their listeners need you.
FINDING #2
The Titles That Did Best Say What You Do for Someone
Two groups beat the average.
• Consultants, advisors, coaches, and strategists: 131 (95% CI: 111 to 151). Hosts said yes to them about a third more often than to everyone else. That gap holds campaign by campaign, not just in the pooled totals (p = 0.04).
• Physicians, clinicians, and therapists: 125 (95% CI: 100 to 150). It’s a strong showing from a small group of six campaigns, so we read it as a signal rather than a rule.
Look at how those titles are written. “Fractional CFO for Service Business Owners.” “Franchise Consultant.” “Clinical Nutritionist.” “Executive Advisor & Strategist.” Each one names a job done for a person, and often names the person. That’s the exact question a host is trying to answer: would my listeners be better off for hearing this?
“Founder & CEO, [Company]” answers a different question: how important is this guest? Hosts told us in our Host Perspective Study which question matters to them. They ranked expertise and relevance first and celebrity last.
Bottom Line: We’re interpreting why, not proving it. These groups also differ in topic, industry, and audience. A title that names a service may simply belong to guests with a clearer topic.
If your title describes your status, add a line that describes your service. Who do you help, and with what?
A title tells a host how important you are.
Hosts are asking how useful you’ll be.
FINDING #3
The Title Is a Rounding Error Next to Everything Else
Averages hide people. So we plotted every campaign.
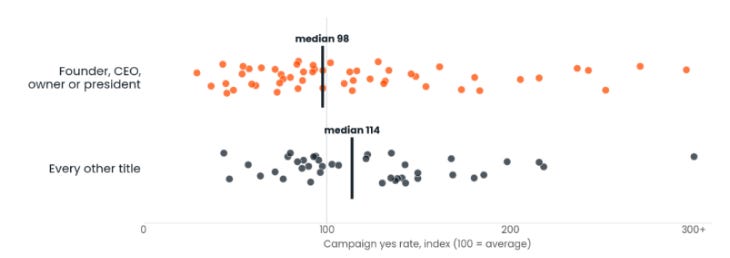
Each dot is one campaign with 25+ introductions. The bar is the group median.
• Founder campaigns run from 29 to 296 on the index. That’s a tenfold spread inside one title. The middle half alone runs from 73 to 146.
• 55% of non-founder campaigns outperformed the median founder campaign. If a CEO title were the key, that number would be near zero.
• Founders make up 57% of all campaigns, 57% of the top quarter, and 74% of the bottom quarter. The title doesn’t lift anyone into the top tier. If anything, it shows up more often among the campaigns that struggle.
What separates the top of that chart from the bottom isn’t the title. It’s the topic, the audience match, and the introduction itself.
THE PATTERN
How This Fits What We’ve Already Found
This is the third time our data has tested a credential that “everybody knows” matters.

Hosts keep telling us the same thing in different ways. They aren’t inviting a résumé. They’re inviting a conversation their audience will want.
DECISIONS
What This Means For You
• If you lead with “Founder & CEO,” add the second line. Keep the title, and follow it right away with who you help and what changes for them. That’s the line that matches you to a host’s audience.
• If you’re a consultant, coach, or advisor, stop apologizing for your title. It’s doing more work than you think, because it already tells a host who you serve.
• Write the title for the host’s listener, not your org chart. “CEO, Acme” is about you. “Helping CFOs at growing SaaS companies cut close time in half” is about them.
• If you host, notice your own pattern. The data says you invite fit and relevance far more than rank. Your instincts are already ahead of the myth.
Questions to Ask Yourself
• Read the first line of your bio as a host would. Does it say who you are, or who you help?
• If you removed your title, would a host still know why their audience needs you?
• Which credential are you leaning on that a host has seen a hundred times this month?

Tiffany Meenk, Marketing Manager at Interview Valet
Let’s Talk About It
Chat or Talk with Tom Schwab’s AI.
You’re always one conversation away. Have one with the Tom-bot, my AI-trained clone with 11 years of my answers and none of my calendar constraints. Chat or talk about this study, the data, or podcast interview marketing in general.
Work With An Agency That Runs on Data, Not Folklore
Interview Valet is the category designer of Podcast Interview Marketing. For 11 years, we’ve matched category-designing B2B and health/wellness leaders with the podcast interviews that actually reach their ideal customers, selected on data like the data in this report, not on common sense myths that turn out to be false.
Coming Up
Next week we continue the series Podcast Interviews: Decisions Based On Data
Ghost Episodes: What Percentage of Recorded Interviews Never Air?
Methodology & Limitations
Source. Interview Valet’s internal campaign database. We used every introduction our team sent to a podcast host between October 1, 2025 and September 30, 2026, dated by the day it was sent. An introduction counts as a yes when the host invited the guest, whether or not the interview was later recorded. Yes rate = invitations ÷ introductions.
Title classification. Each campaign was classified once, before any yes rates were computed, from the first title line of its host-facing guest summary, the line a host reads first. Where that line held several titles, the first one decided the group.
Groups: founder, CEO, owner, or president; partner, principal, or other executive; physician, clinician, or therapist; consultant, advisor, coach, or strategist; author, speaker, or subject expert. Fractional executive roles (”Fractional CFO”) were classified as advisors, because the role is a service to other companies.
Who’s included. 94 client campaigns with a host-facing summary on file, covering 56% of all introductions sent in the window. Campaigns without a summary on file were excluded, along with Interview Valet’s own internal campaigns and two summaries that had no title line.
Statistics. Pooled group rates are indexed to the all-campaign average (100), with 95% confidence intervals. Founder vs. all others, pooled: two-proportion z-test (p = 0.01), which does not survive removing the three largest campaigns (index 98). Campaign-level comparisons use campaigns with 25+ introductions. Founder vs. others: Mann-Whitney U, p = 0.23 (no reliable difference). Advisors vs. others: Mann-Whitney U, p = 0.04. All groups together at campaign level: Kruskal-Wallis, p = 0.17.
Why relative numbers only. Absolute yes rates, introduction counts, and invitation counts are confidential to our clients and our business. Every result is an index or a percentage of campaigns.
Limitations
Coverage. The summary field is relatively new, so the study covers just over half of the window’s introductions. Campaigns without a summary had a somewhat higher overall yes rate than those with one, so the absolute level may not generalize. The comparisons between titles are within the covered set.
• Small groups. The clinician (6 campaigns) and executive (8) groups are small. Read them as signals.
• No controls. Titles travel with topic, industry, seniority, and author status. This report measures the difference a host sees at the first line, not the causal effect of a title.
• One title per campaign. Multi-speaker campaigns were classified by the lead speaker’s title.
• One agency’s introductions. Every introduction went to a show our team had already vetted for fit. In cold outreach, where fit isn’t pre-screened, a title might have to do more work.
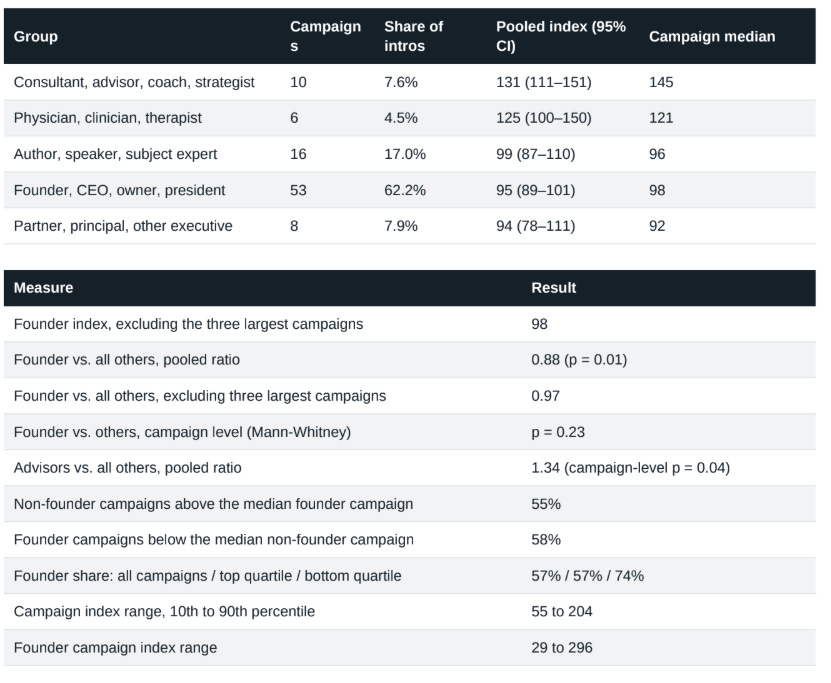
Appendix A: Every Cut We Ran
Index: 100 = average yes rate across all 94 campaigns.