The Myth Got Bigger. The Data Didn’t Care.
We recently tested the “common sense fact” that reviews drive podcast rankings. Across 400 top-charting shows, review counts explained 3% of chart position or less, and Apple itself confirmed reviews are not in the algorithm. This week, the myth gets a bigger stage.
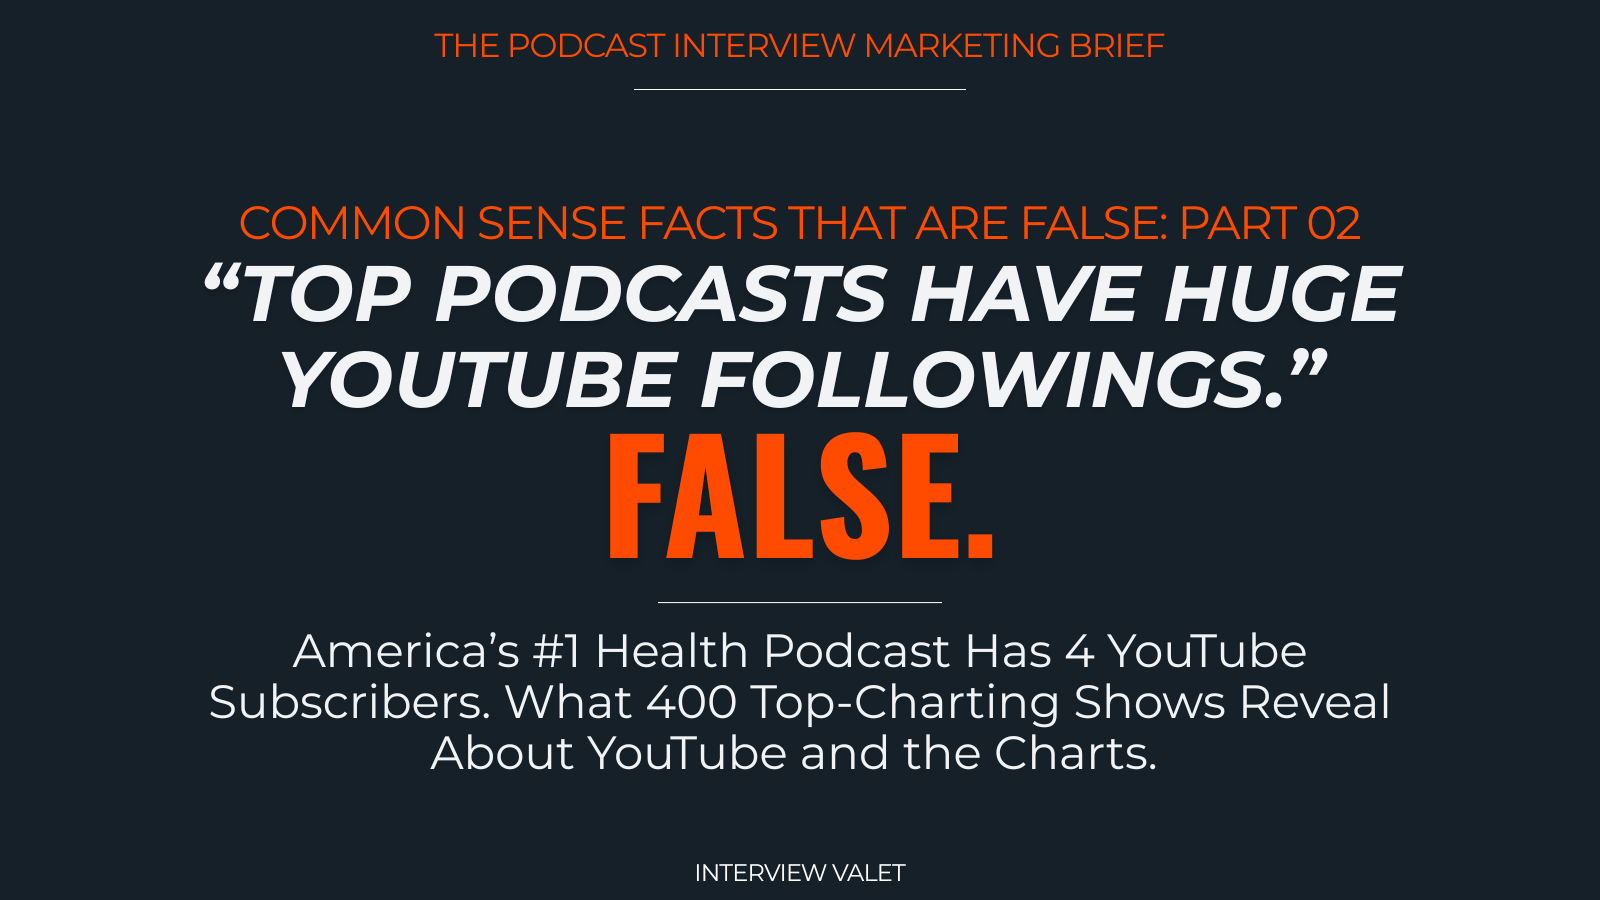
“Top podcasts have huge YouTube followings. If you want to chart, you need a big channel.” You hear it everywhere now that YouTube is called the biggest podcast platform. It sounds even more obvious than the review myth.
Same two reactions. As a category designer, I reject the premise. As an engineer who ran nuclear power plants in the Navy, I want to see the data. So we pointed the instruments at YouTube.
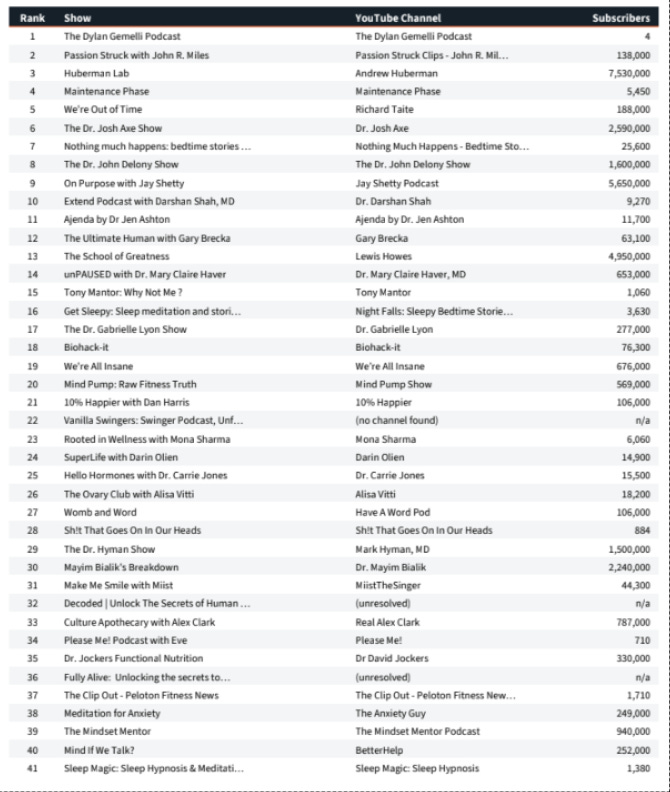
The #1 health podcast in America has 4 YouTube subscribers. Four.
How We Ran the Study
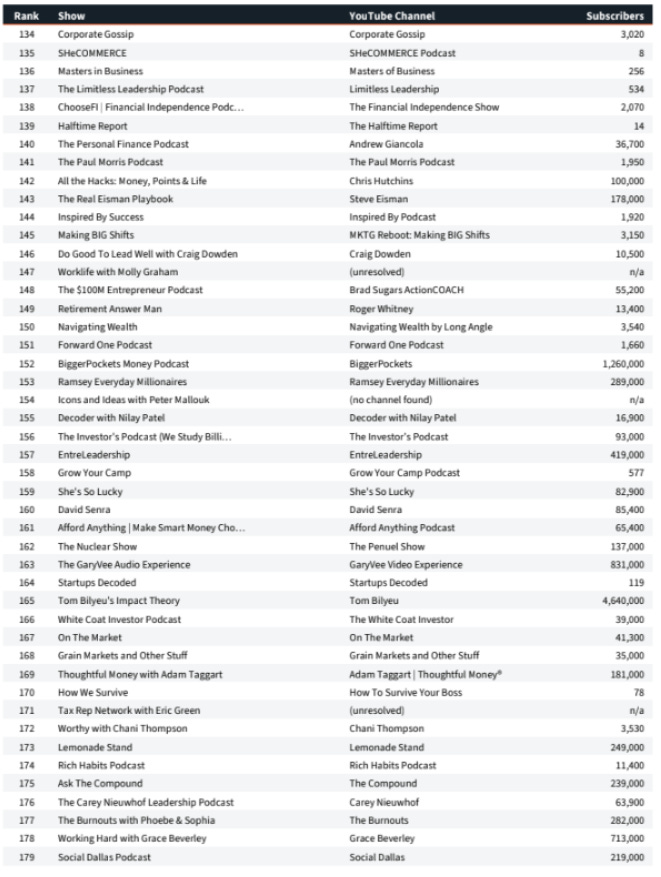
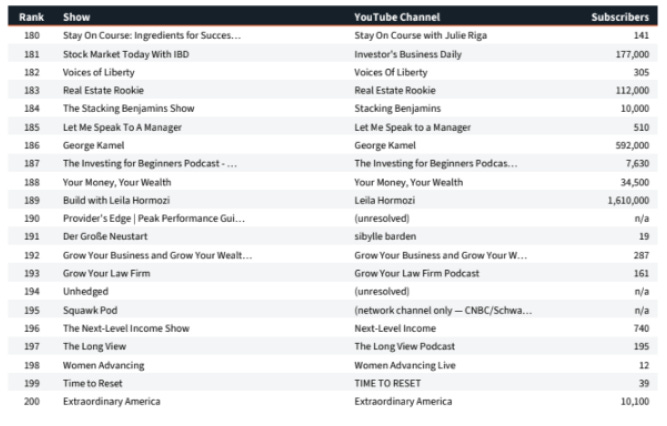
Same 400 shows as Report #1: the complete Apple Podcasts U.S. Top 200 in Business (June 11, 2026) and Health & Fitness (June 12, 2026). For each show, we identified its YouTube channel, preferring the channel each show links to on its website, then verified matches by name search. We recorded subscriber counts for 175 business shows and 168 health shows. Ten business shows and six health shows have no YouTube channel we could find at all. Every match, every count, and every unresolved show is disclosed in the methodology and appendices.
Finding #1: The #2 Business Show Has 98 Subscribers
On snapshot day, the #2 business podcast in America had a YouTube channel with 98 subscribers. Meanwhile, Impact Theory, with 4.6 million subscribers, sat at #165 on the chart, and Leila Hormozi’s 1.6 million sat at #189.
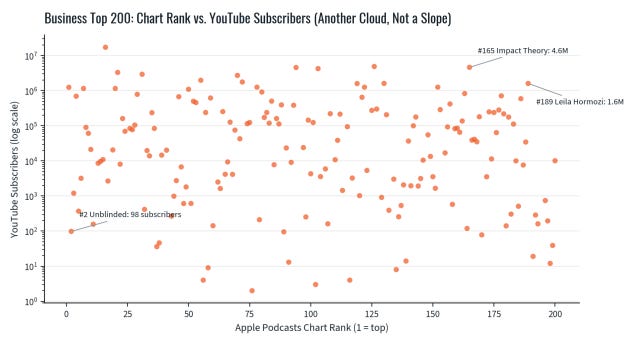
Each dot is a top-200 business show with a verified channel. A real relationship would slope from upper left to lower right. This is a cloud.
Correlation between chart rank and YouTube subscribers: ρ = 0.08, statistically indistinguishable from zero. Subscribers explain less than 1% of chart position.
Median verified channel: 24,000 subscribers. 41% have fewer than 10,000. 23% have fewer than 1,000.
10 top-200 business shows have no YouTube channel at all. They chart anyway.
Shows ranked 51-100 have a median of 114,000 subscribers. Shows ranked 1-50 have a median of 20,000. The middle of the chart out-YouTubes the top.
Finding #2: Health & Fitness. Giants in the Basement
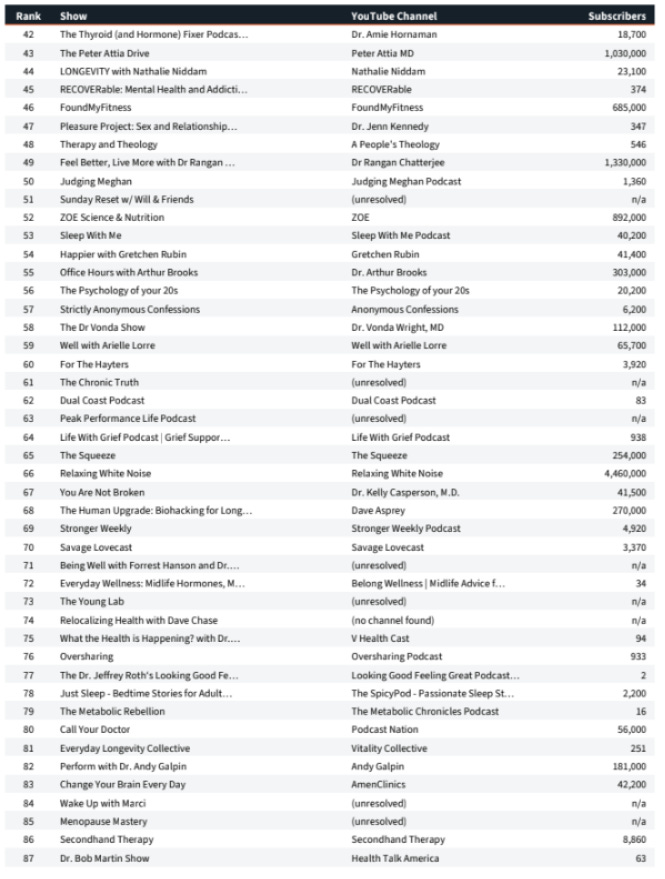
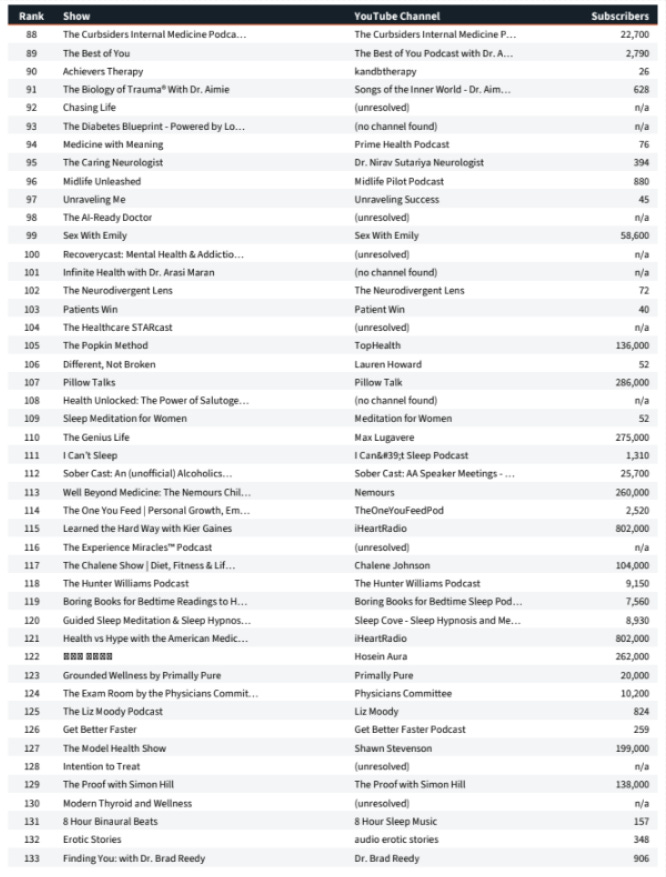
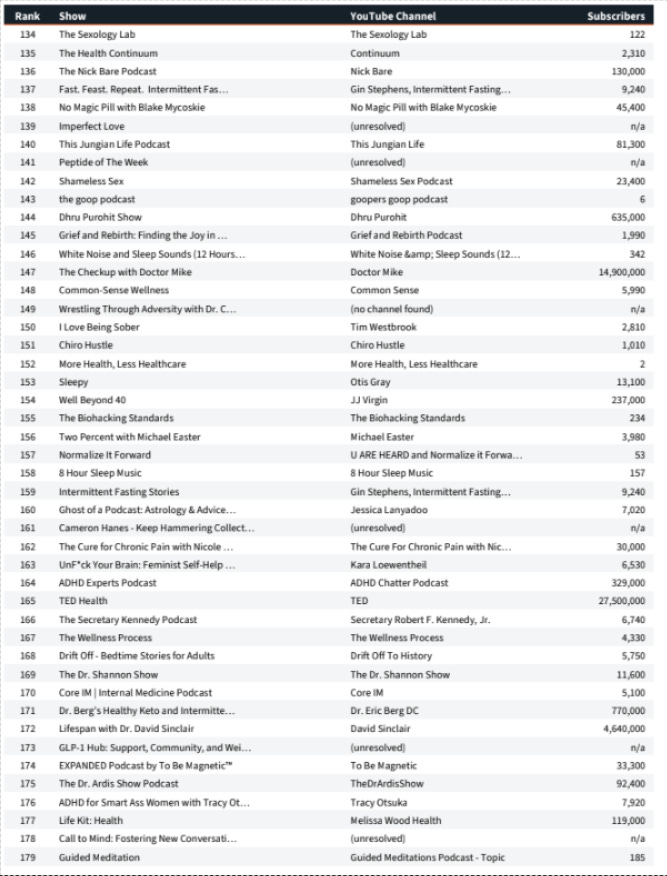
Health is supposed to be YouTube country: Huberman, Shetty, Doctor Mike. And yes, Huberman Lab’s 7.5 million subscribers sat at #3. But TED Health’s 27.5 million sat at #165. Doctor Mike’s 14.9 million sat at #147. And the #1 show in the entire category had 4 subscribers.
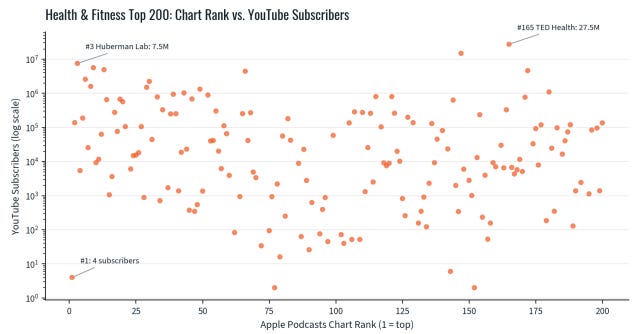
The biggest YouTube channel in the dataset (27.5M) ranks 165th. The #1 chart position belongs to a channel with 4 subscribers.
Correlation: ρ = 0.17. Real but tiny: subscribers explain about 3% of chart position.
Median verified channel: 15,200 subscribers. 47% have fewer than 10,000.
In Business, ranks 51-100 had the highest median subscribers. In Health, ranks 51-100 had the lowest (4,420). When a pattern flips sign between two categories, it isn’t a pattern. It’s noise.
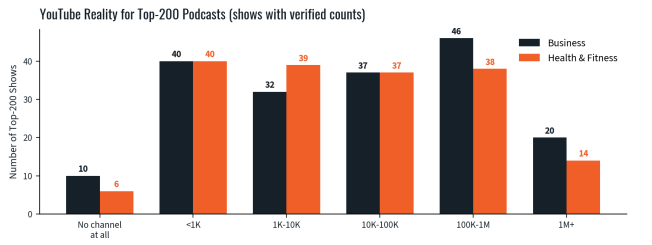
The YouTube reality of the top 200: small channels and no channels dominate. Seven-figure channels are outliers, not requirements.
Why the Myth Feels True (and Why It Can’t Be)
Here is the structural fact the myth ignores. Apple’s charts measure activity inside Apple Podcasts: listening, follows, and completion in Apple’s own app. YouTube is a different company’s platform, and the two share no data. A YouTube subscription cannot move an Apple chart even in principle. The myth isn’t just statistically wrong. It’s mechanically impossible.
Add last week’s lesson: subscriber counts, like review counts, are cumulative. They are an odometer reading of accumulated fame. The chart is a speedometer reading of current momentum inside one specific app. Different instruments, different platforms, different physics.
What This Means for You
Judging a podcast by its YouTube subscribers is reading a gauge from a different machine. It tells you about the host’s video audience, not the show’s podcast audience.
If you’re a guest, a show with no channel can still put you in front of thousands of your ideal customers. Ten top-200 business shows have no YouTube at all. Their listeners didn’t get the memo that they don’t count.
If you host, YouTube is a choice, not a toll booth. Build a channel because video serves your strategy, not because folklore says the chart demands it.
Measure what’s native to the outcome you want. Podcast goals need podcast metrics. Video goals need video metrics. Borrowed metrics produce borrowed conclusions.
Questions to Ask Yourself
When you subscribe to a YouTube channel, do you think Apple finds out? (It doesn’t.)
Do you watch full podcast episodes on YouTube, or 60-second clips between other videos?
Is a subscriber who never presses play a listener, or a statistic?
“A YouTube subscriber cannot move an Apple chart. The two platforms don’t even share data.”
Report finding, June 2026
Next in the Series
Report #3: “Top podcasts have huge social media followings.” Spoiler: 1 in 10 top-charting shows has no social media presence we could find at all. Same charts. Same instruments. Same week-from-now release.
Talk With Me About This Report
Chat or talk with my AI.
You’re always one conversation away. Have one with the Tom-bot, my AI-trained clone with 11 years of my answers and none of my calendar constraints. Chat or talk about this study, the data, or podcast interview marketing in general.
Work with an agency that runs on data, not folklore
Interview Valet is the category designer of Podcast Interview Marketing. For 11 years, we’ve matched category-designing B2B and health/wellness leaders with the podcast interviews that actually reach their ideal customers, selected on data like the data in this report, not on common sense myths that turn out to be false.

Tom Schwab is the founder and Chief Evangelist Officer of Interview Valet, the first and longest-running podcast interview marketing agency. He is the author of Podcast Guest Profits: Grow Your Business with the Targeted Interview Strategy and the recent mini-book From Megaphone to Magnet: The HOW for Creator Capitalists. A U.S. Navy veteran who ran nuclear power plants on aircraft carriers, Tom has spent his career insisting that decisions be made on instruments, not instincts. He lives in southwest Michigan with his wife Karen.
Methodology & Limitations
Charts. Apple Podcasts U.S. “Top Shows” charts, Business (genre 1321) captured June 11, 2026, and Health & Fitness (genre 1512) captured June 12, 2026. 200 shows per category.
YouTube channels. Primary source: the channel each show links from its own website or RSS feed (highest confidence). Fallback: YouTube channel search verified by name match against the show and publisher. Every low-confidence match was manually reviewed; wrong or ambiguous matches were excluded rather than guessed. Network-wide channels (for example, CNBC’s main channel for its individual shows) were excluded as not show-specific.
Coverage. Business: 175 of 200 shows with verified subscriber counts; 10 with no channel found; 11 unresolved after review; 4 network-excluded. Health & Fitness: 168 verified; 6 with no channel; 26 unresolved. Unresolved shows are marked in the appendices.
Statistics. Spearman rank correlation between chart position and subscribers. Business: ρ = 0.08, not statistically significant (subscribers explain under 1% of chart position). Health & Fitness: ρ = 0.17, statistically detectable but explaining only about 3%. For context, last week’s review study found the same pattern: across both categories, fame metrics and chart position barely speak to each other.
Limitations. (1) YouTube displays rounded subscriber counts (for example, “1.2M”), so figures are approximate. (2) Subscriber counts are cumulative while charts measure recent in-app momentum. (3) Single-day snapshot. (4) Structurally, YouTube activity is not an input to Apple’s charts, which measure listening, follows, and completion within Apple Podcasts.
Reproducibility. The complete dataset follows in Appendices A and B. Check our work. That’s the whole idea.
Appendix
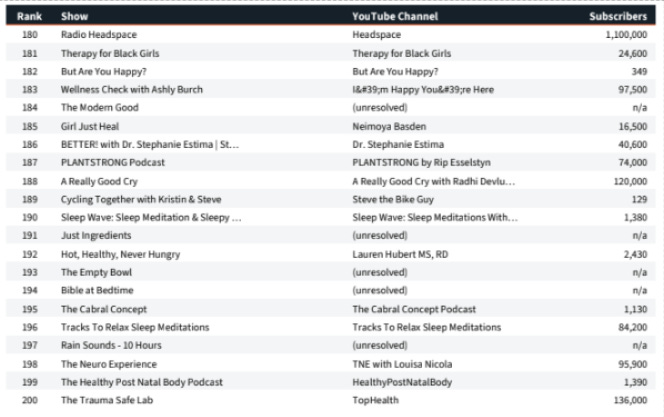
Appendix A: Business Top 200 YouTube Data (June 11, 2026)
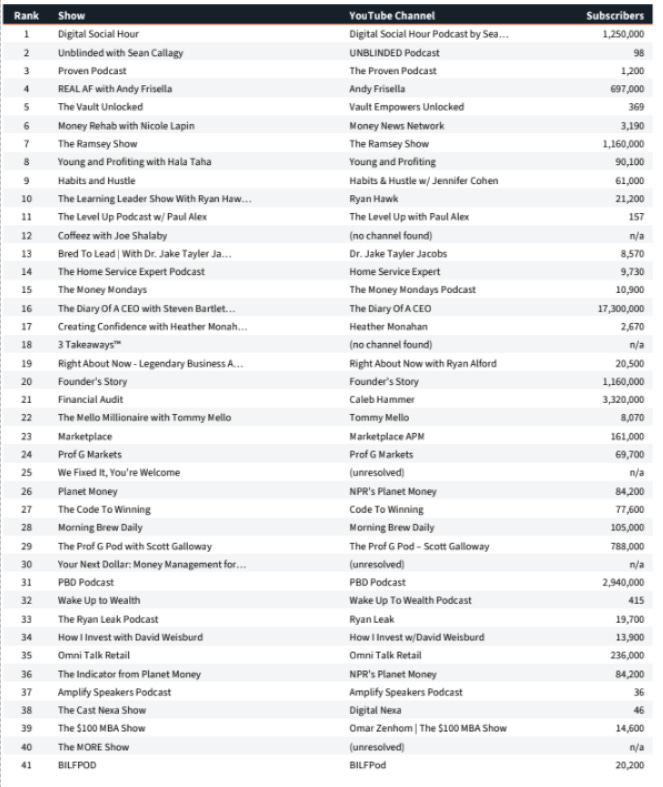
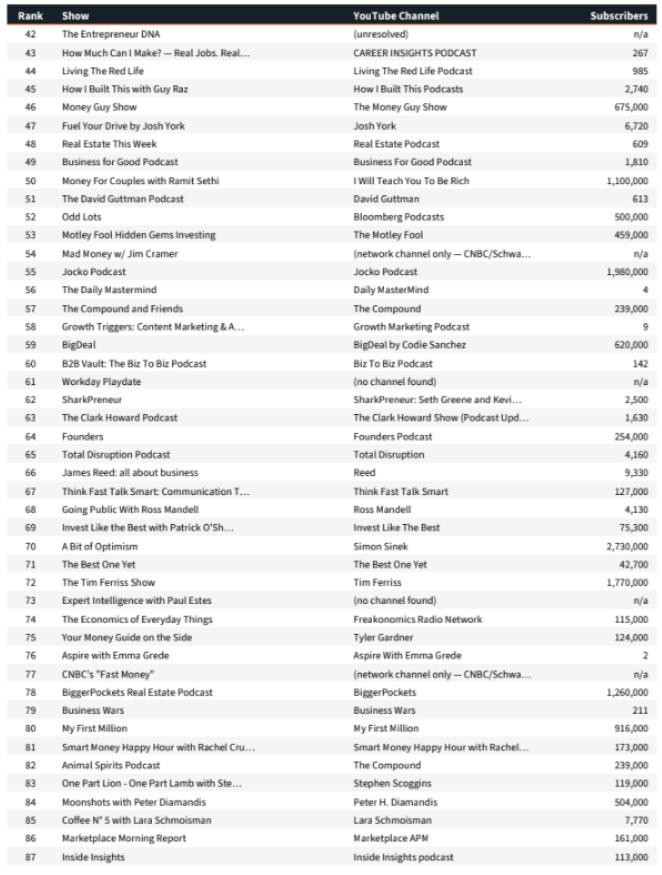
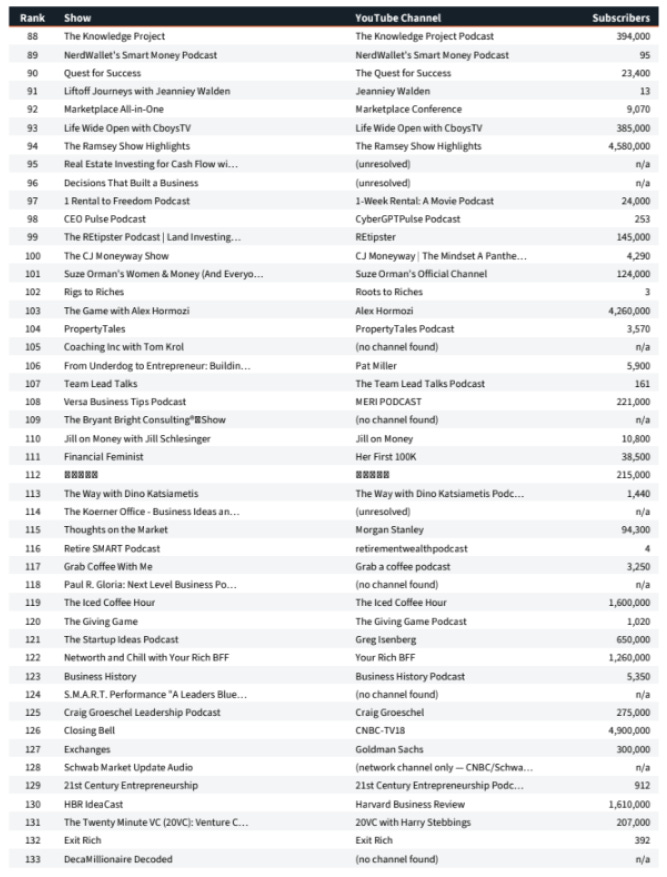
Appendix B: Health & Fitness Top 200 YouTube Data (June 12, 2026)